• Home
  • Features
  • Live trading results
  • Blog
  • Dashboard
  • PST Terminal
  • Stocks Dashboard
  • Contact
February 15, 2026 by TraderNomad

Silver Rally at Risk? Signs the Upside Continuation May Be Stalling

Silver Rally at Risk? Signs the Upside Continuation May Be Stalling
February 15, 2026 by TraderNomad

Table of Contents

Toggle
  • Silver uptrend is still intact
  • Silver rejected from the top 
  • Is this a critical turning point

Silver uptrend is still intact

  • According to the Silver Institute, global silver demand is expected to remain steady in 2026, with retail investment rising strongly, helping offset declines in jewelry and industrial use. Supply is forecast to grow modestly — leaving the market in a structural deficit for the sixth consecutive year.

  • Retail investors continue to pour money into silver ETFs even as prices plunged. Over a recent six-day span, retail inflows into the largest silver ETF (SLV) topped $430 million, highlighting strong speculative interest despite the volatile price action.

  • Markets experienced quick sharp selloffs mid-week, with gold and silver both posting sudden intraday losses — a sign of ongoing high volatility.

  • Precious metals (including silver, gold, PGMs) continued to register strong weekly price swings, driven by macroeconomic news and risk sentiment.

Silver rejected from the top 

Silver reached a parabolic top of 122 and has been rejected. This cause a sharp reversal back into the long-term uptrend channel beneath 80. Silver bulls lost momentum due to a strong take profit and short covering as many investors got scared because of a sharp parabolic rise. That reasoning is completely justified looking at the price action and historical tops in 1980 and 2011.
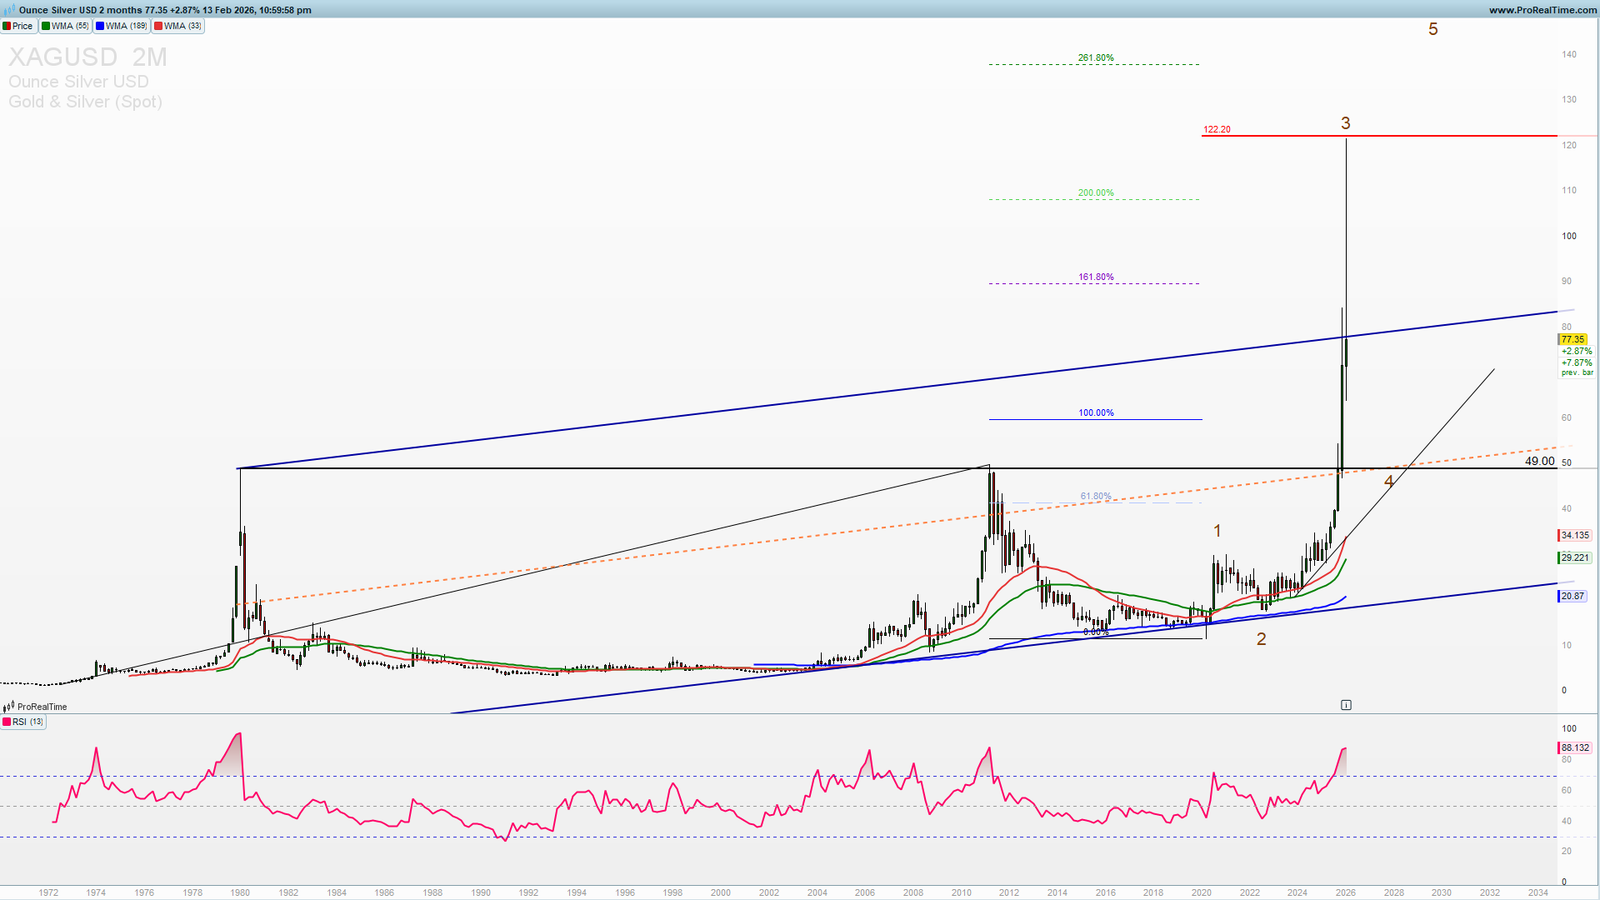
Silver monthly chart

Is this a critical turning point

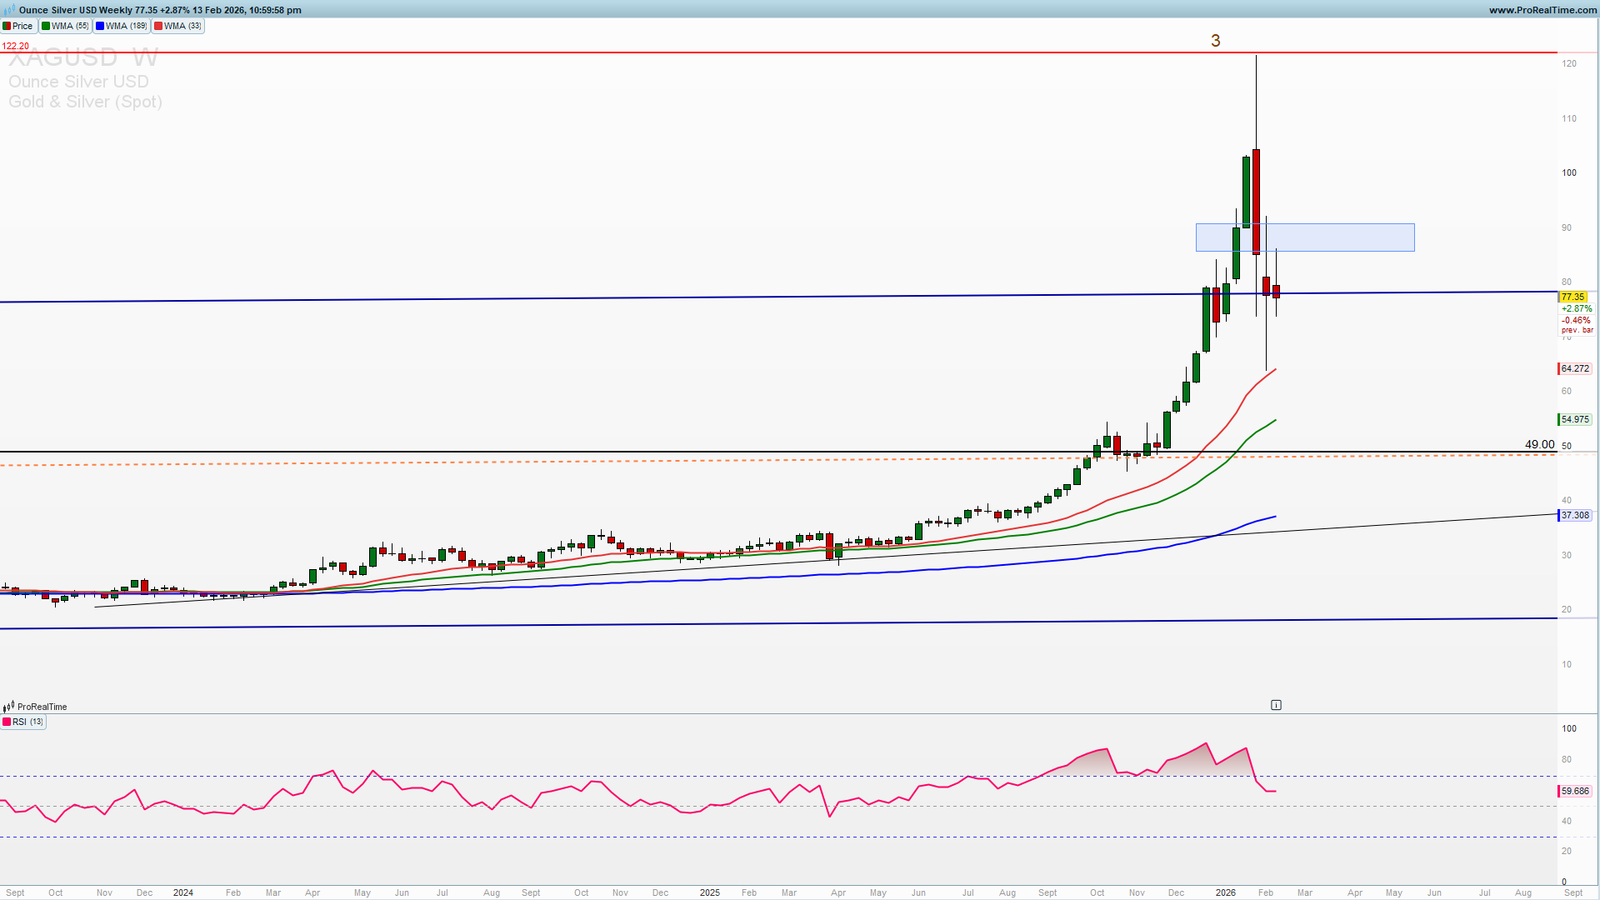
Silver is rotating higher from 64 as you can see on the weekly chart. This rotation is still weak as we have a strong rejections in the past two weeks from 85-90 zone. This zone is now critical for an upside continuation or another swing lower to 55.
Silver weekly chart
Silver weekly chart

On the weekly chart you can see a strong bounce level 65 (join to get premium analysis, weekly and mid-week newsletter and other tools for for your successful trading 30% discount) indicated on the long-term chart. A break above 90 and a weekly close above this level is needed for an extension higher.

Trade this setup with my preferred broker 👇

Open a Trading Account


On a daily chart visible is a declining wedge which can lead to an acceleration higher, the only question is will we see a new test of the lower wedge support level 55. If we get an impulsive break above the upper wedge resistance 90 that will increase the probability of a continuation higher. Look for a breakout confirmation on the lower timeframes.
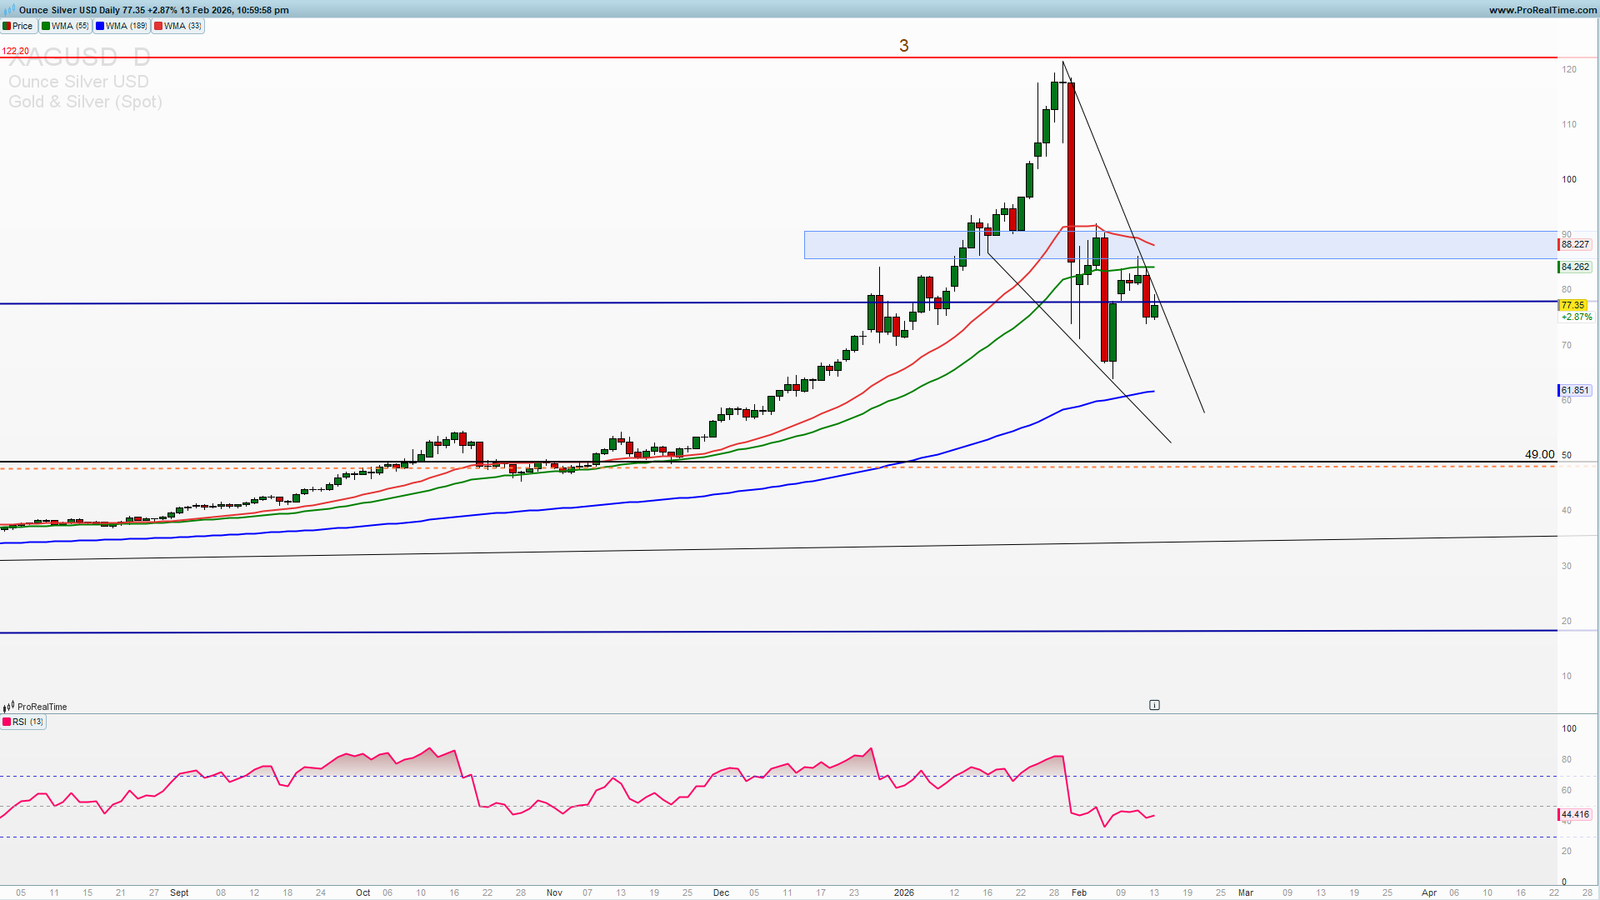
Silver daily chart
Silver trade setup

Plan your trades in both directions in line with your risk profile and account equity

Get Access to Trade Setups

Trade safe!


Previous articleIs Bitcoin More Attractive Than Gold in 2026?Bitcoin weekly chartNext article Here's what traders and investors need to watch with NVDANVDA daily chart

Leave a Reply Cancel reply

Your email address will not be published. Required fields are marked *

Premium and free trade analysis articles

Recent Posts

Ethereum Bullish Setup Surges Toward Critical $2,500August 22, 2026
Nasdaq100 Reversal: NQ Rejected at 15-Year Channel Top 2026August 16, 2026
XAGUSD Bullish Reversal: Silver Breaks $67.40 Toward $80August 8, 2026

Categories

  • Trade analysis

Tags

August 2026 Bearish Breakdown Bearish Setup Bearish Stocks 2026 Bitcoin Bitcoin Analysis 2026 Bitcoin Elliott Wave Bitcoin Price Prediction Bitcoin Sup BTC June 2026 BTC port Levels USD BTC Technical Analysis Crude Oil Elliott Wave Elliott Wave Signals ETF Comparison GLD Analysis GLD ETF GLD Price Target GLD Technical Analysis Gold Buy the Dip Gold ETF 2026 July 2026 Micron Nasdaq-100 NVDA NVDA Elliott Wave NVIDIA NVIDIA Bullish ProSignalTrades ProSignalTrades 2026 ProSignalTrades Review QQQ Rising Channel Semiconductor ETF Semiconductors SMH SPDR Gold Shares SPDR Gold Trust Stock Analysis Support Levels Technical Analysis Trading Research Platform Trading Signals Review WTI

Why PST

15+ years of trading experience — analysis built on real market knowledge, not theory.

Get Started Now!

Contact

info@prosignaltrades.com

Recent Posts

Ethereum Bullish Setup Surges Toward Critical $2,500August 22, 2026
Nasdaq100 Reversal: NQ Rejected at 15-Year Channel Top 2026August 16, 2026
XAGUSD Bullish Reversal: Silver Breaks $67.40 Toward $80August 8, 2026
ProSignalTrades Wordpress Theme. Proudly Built By PST
TOS and Privacy Policy

Recent Posts

Ethereum Bullish Setup Surges Toward Critical $2,500August 22, 2026
Nasdaq100 Reversal: NQ Rejected at 15-Year Channel Top 2026August 16, 2026
XAGUSD Bullish Reversal: Silver Breaks $67.40 Toward $80August 8, 2026