Gold (XAUUSD) is at one of the most critical technical junctures of 2026. After reaching a high near $5,400 earlier this year, gold has entered a sharp corrective phase — dropping to a weekly close of $4,219.06, with the RSI falling to 39.24, its weakest reading of the entire bull cycle. The selling has been driven by a break of the primary ascending trendline that had supported every leg of the 2025 advance, shifting market character from a steady grind higher to a faster, two-sided market.
The question every gold trader is asking: is this a healthy correction inside a continuing bull market, or the start of something larger?
Our analysis identifies two critical pivot levels: above $4,500 is bullish and signals the correction is likely complete, while below $4,000 is bearish and opens the door to a much deeper retracement.
For broader market context, also read our GLD ETF Analysis and Bitcoin BTC/USD Outlook.
Live Gold XAU/USD price — Investing.com
World Gold Council
Why the Trendline Break Changes the Picture
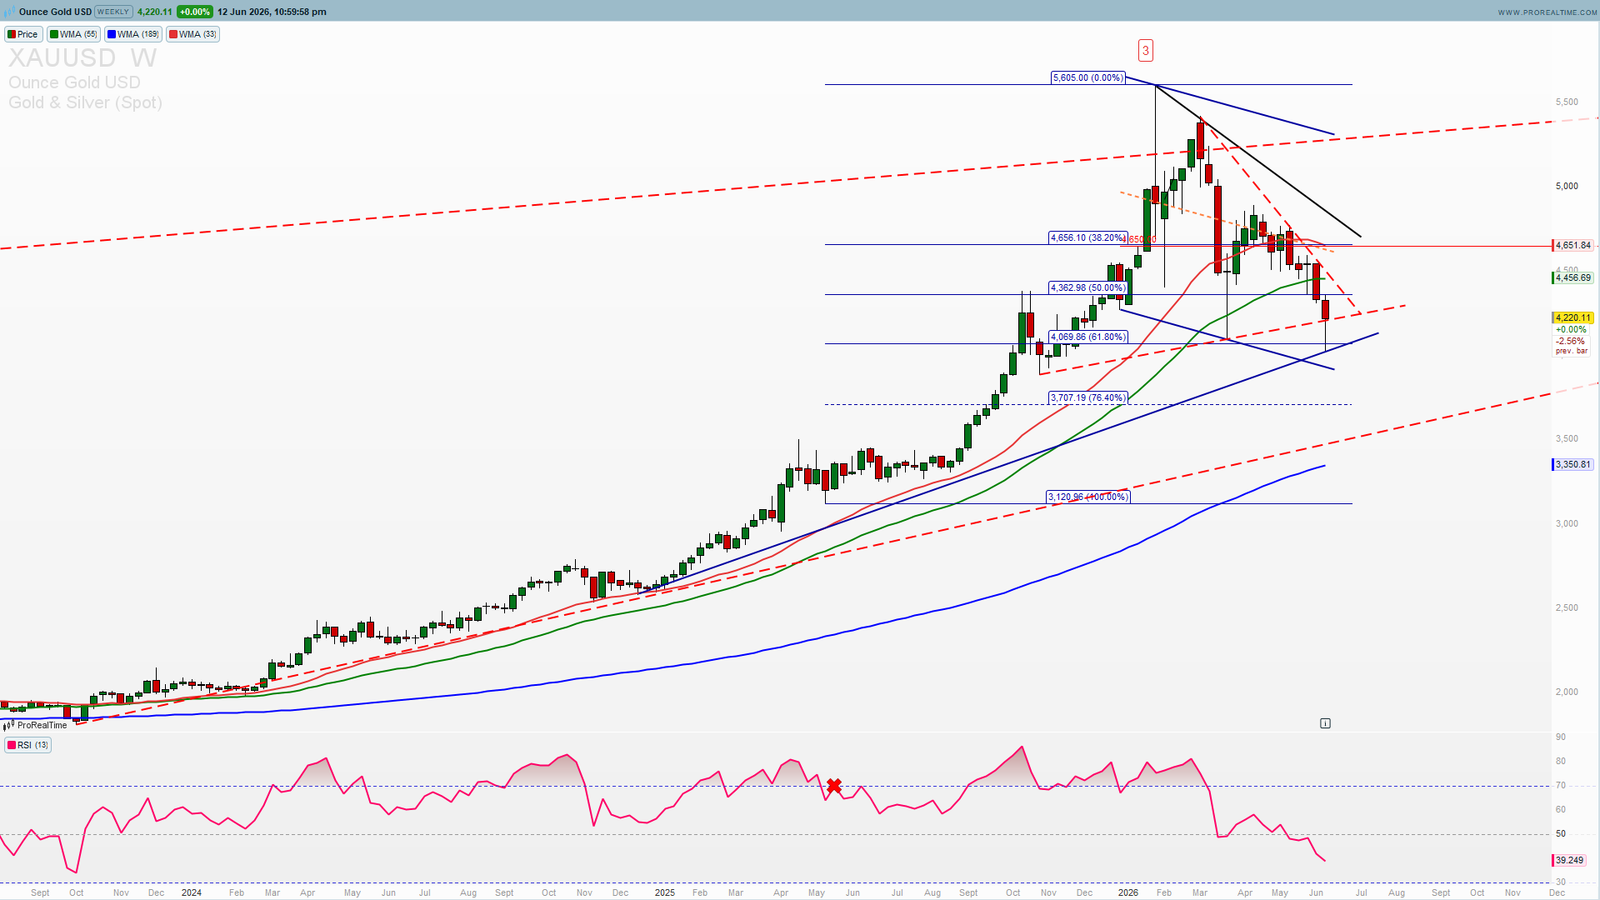
The blue ascending trendline connecting the 2025 swing lows had not been violated on a weekly closing basis throughout the entire rally from roughly $2,700 to $5,400. That changed in the most recent decline — and it matters.
A break of a trendline that held for over a year doesn’t automatically mean the bull market is over. But it does mean the character of the move has changed. Momentum has shifted from a steady, low-volatility grind higher to a faster, two-sided market.
RSI at 39.24 — Weakest of the Cycle
The weekly RSI(13) has dropped to 39.24, its lowest reading of the entire advance, confirming that downside momentum is now the dominant short-term force. It is not yet in oversold territory below 30 — a further drop toward 30 alongside a test of $4,000 would be a classic capitulation signature.
Gold Technical Analysis — The Weekly Chart
Looking at the XAUUSD weekly chart, several critical technical observations emerge:
The Parabolic Rise and Sharp Correction
Gold’s chart shows a powerful trending advance from the 2025 lows near $2,700 to the 2026 highs near $5,400 — driven by central bank buying, safe-haven demand and a weaker dollar. Since that peak, the correction has been sharp, with the weekly close now at $4,219.06, roughly 22% off the high.
Fibonacci Map of the Correction
Measuring the retracement from the 2025 low to the 2026 high gives a clean roadmap for where buyers and sellers are likely to engage:
38.2% — $4,704.78: First resistance above current price; a recovery above this level would suggest the correction was shallow and the uptrend remains intact.
50.0% — $4,427.44: The midpoint of the entire advance and the first real test for bulls on any rebound attempt.
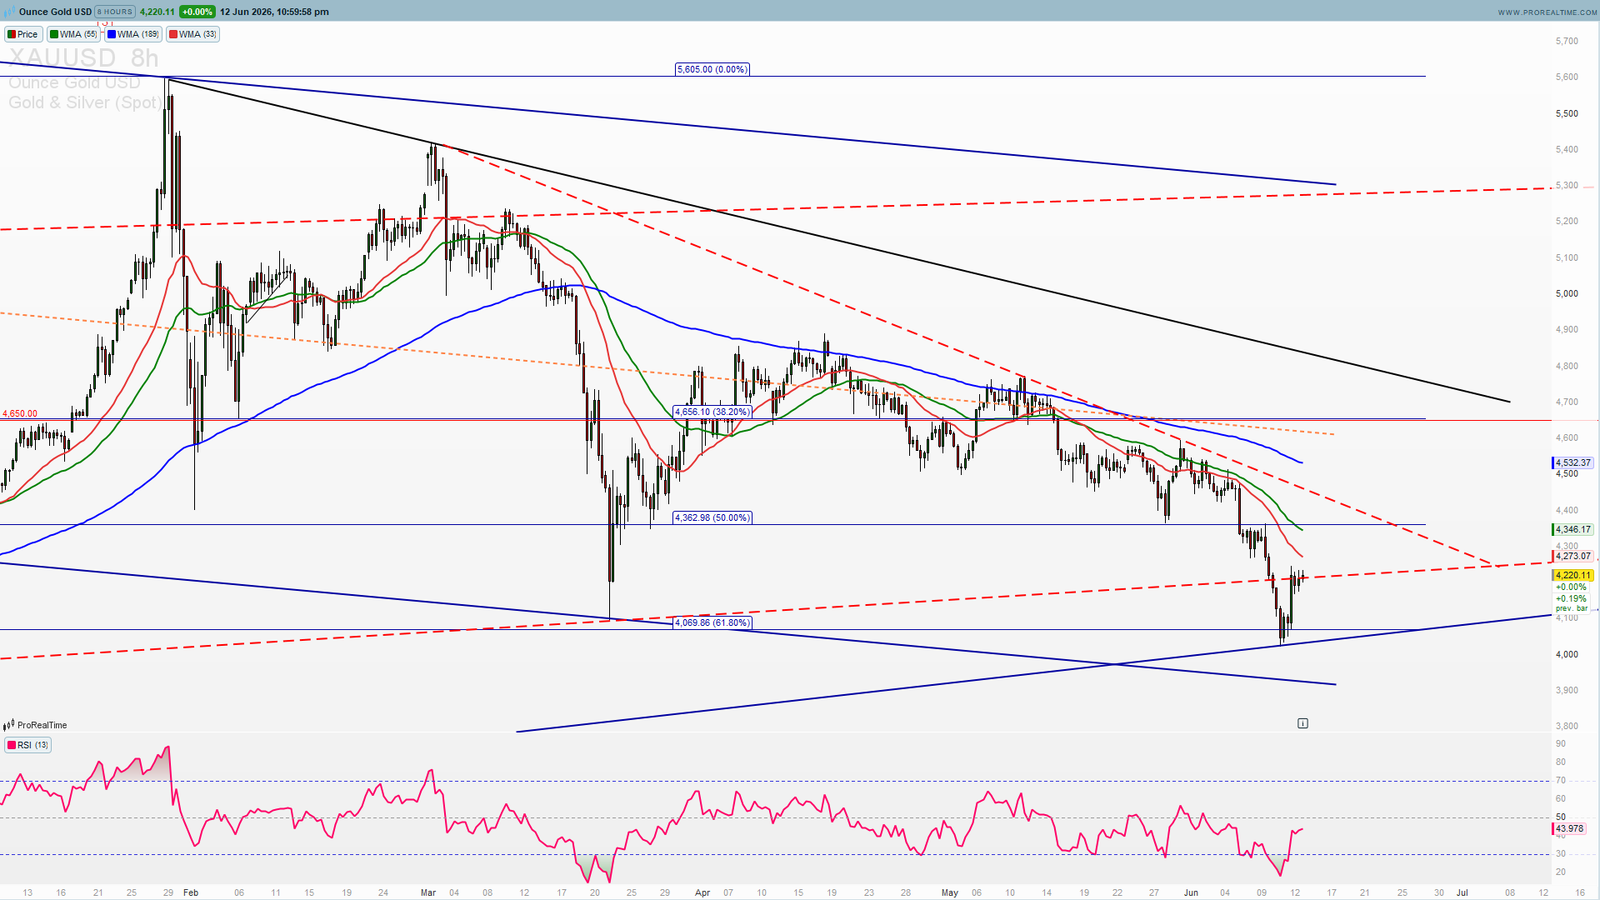
61.8% — $4,150.10: The “golden ratio” support — price is currently trading just above this level, making it the most immediate line of defense for the bulls.
76.4% — $3,806.95: A deeper retracement level that would only come into focus if the $4,000 psychological floor gives way.
What stands out is how closely these Fibonacci levels align with the round-number zones traders already watch. The 61.8% retracement at $4,150 sits just above $4,000, while the 50% retracement at $4,427 sits just below $4,500 — reinforcing both round numbers as genuine confluence zones rather than arbitrary levels.
The Two Critical Pivot Levels
$4,500 — The Recovery Signal (BULLISH ABOVE)
A sustained weekly close back above $4,500 would be the clearest signal that the correction is running out of steam. This level sits just above the 50% retracement and represents the first meaningful “higher low confirmed” zone for the broader uptrend.
In Elliott Wave terms, a recovery through this area — ideally on improving RSI momentum back above the 50 mid-line — would support the view that the current decline is a corrective wave (an A-B-C structure) rather than the start of a new bearish impulse. A confirmed close above $4,500 signals:
The corrective phase is likely over and the bull trend is resuming.
The 38.2% retracement at $4,704.78 becomes the next logical target.
The prior highs near $5,400 remain the longer-term objective.
$4,000 — The Line in the Sand (BEARISH BELOW)
The $4,000 level is the single most important support for gold in the current environment. It represents the major psychological round number and sits just below the 61.8% Fibonacci retracement at $4,150.10.
If gold breaks and sustains below $4,000 on a weekly close basis, the technical picture deteriorates significantly:
The 61.8% golden-ratio support at $4,150 would already be broken on the way down.
The next downside reference becomes the 76.4% retracement near $3,806.95.
Gold would likely spend considerably longer rebuilding a base before new highs are realistically back on the table.
Key levels between the two pivots:
$4,704.78 — 38.2% retracement, first resistance above current price
$4,500.00 — bullish trigger and recovery signal
$4,427.44 — 50% retracement, midpoint of the rally
$4,219.06 — current weekly close
$4,150.10 — 61.8% retracement, immediate support
$4,000.00 — bearish trigger and psychological floor
$3,806.95 — 76.4% retracement, deeper downside target
Why the Range Between $4,000 and $4,500 Matters
Between $4,000 and $4,500, gold is technically in “no man’s land” — the zone where the current weekly close of $4,219.06 sits. This is a region where price action is likely to be choppy and headline-driven, with both bulls and bears able to make a short-term case.
Rather than trying to predict the outcome inside this range, the more disciplined approach is to wait for one of the two key levels to be tested and to react to how price behaves there. A clean weekly close beyond either $4,000 or $4,500 carries far more information than the noise in between — and that’s the moment to act, not before.
Macro Catalysts to Watch
Federal Reserve Policy Path
Any shift in Fed language toward cuts or hikes will directly impact real yields and, in turn, gold’s relative attractiveness as a non-yielding asset.
US Dollar Strength
A reversal in the dollar’s recent trend — in either direction — has historically been one of the strongest short-term drivers of XAUUSD direction.
Central Bank Gold Buying
Continued central bank accumulation has been a structural pillar of the 2025–2026 rally. Any slowdown reported by the World Gold Council would be a meaningful signal for the medium-term trend.
Geopolitical Risk Sentiment
Safe-haven flows into gold tend to accelerate sharply during geopolitical escalation and unwind just as quickly when tensions ease — watch for headline-driven volatility around both key levels.
—
FIFA30
📱 Telegram Signals Feed
💬 WhatsApp Alerts
🛡️ 30-Day Guarantee
—
Gold Outlook June 2026 — Summary
Gold at $4,219.06 is testing one of the most important technical zones of the entire 2025–2026 bull cycle after breaking its primary uptrend line. The RSI at 39.24 confirms downside momentum is currently in control, but the broader structure remains undecided.
The two levels that decide everything:
🟢 Above $4,500 — bullish, correction likely over, next target $4,705
🔴 Below $4,000 — bearish, opens deeper move toward $3,807
Watch the $4,000 floor. Watch the $4,500 reclaim. Watch the Fed and the dollar.
Want real-time gold levels, Elliott Wave counts, and precise trade setups? Access ProSignalTrades Premium →
—
Disclaimer: This analysis is for educational purposes only and does not constitute financial advice. Trading gold and other commodities involves significant risk. Always conduct your own research before making any trading decisions.