


For related setups, also read our XAGUSD Bullish Reversal and our Nasdaq 100 Reversal.
The gold bearish setup is now the dominant structure on the XAUUSD chart. Gold closed at $4,453.17, down 3.08%, after failing at $4,696.95 and rolling over hard. The level that matters from here is $4,381.57 — the horizontal line that has separated every recovery attempt from every breakdown since the correction from $5,590 began.
This is not a collapse. It is a rejection at resistance with a clearly defined line beneath it, and the reaction at that line determines whether this remains a pullback or becomes something larger.
Gold Bearish Setup — Rejection at the Descending Channel
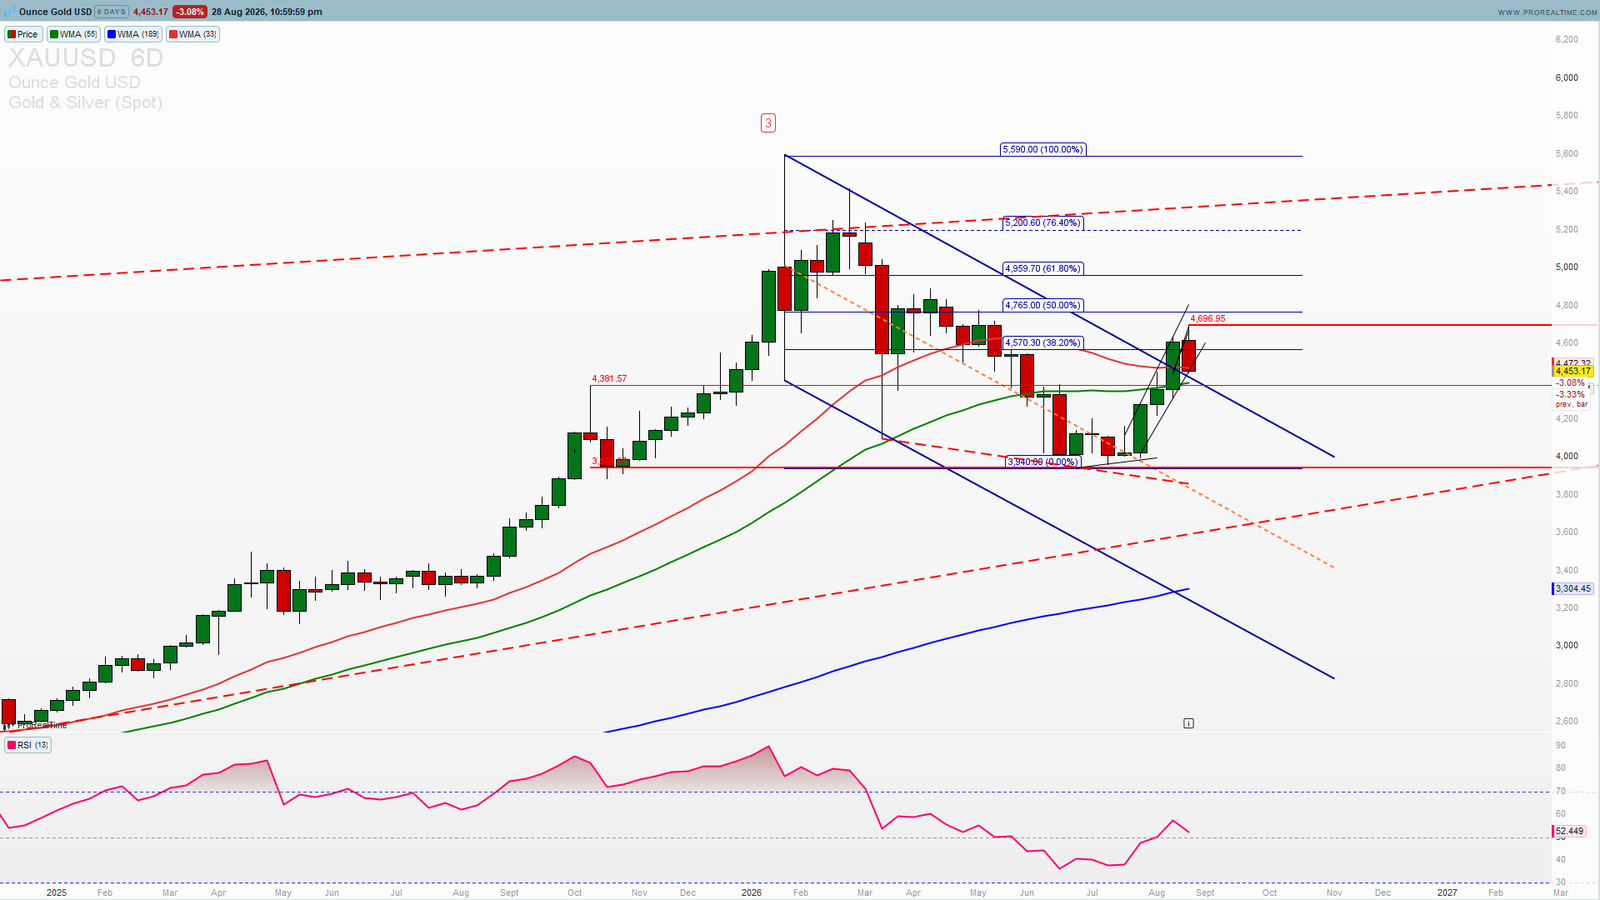
The 6-day chart shows price advancing off the $3,940 base and running straight into the descending channel that has capped every rally since the top at $5,590.00. The high of that move was $4,696.95, right at the channel boundary, and price has since given back most of the advance in a single bar.
The Failure Came at Fibonacci Confluence
The $4,696.95 rejection sits just above the 38.20% retracement at $4,570.30 and below the 50% level at $4,765.00. Price stalled between those two fib levels rather than clearing the 50% mark — the standard threshold for calling a correction complete. Failing to reclaim 50% keeps the broader structure corrective rather than recovered.
RSI at 52.4 Confirms Loss of Momentum
The RSI sits at 52.45, sliding back toward neutral after peaking near 60 during the bounce. It never reached overbought territory during the entire recovery attempt, which tells you the move up lacked conviction. A momentum reading that tops out this low during a rally is a warning about the strength of the buying behind it.
Moving Averages Are Still Overhead
The WMA 33 and WMA 55 remain above current price, with the descending red average sloping down through the recent range. Price closing back below both after briefly poking above them is a structural failure, not a pause.
XAUUSD Key Levels — What a Break Below $4,380 Opens
The confluence here is straightforward: channel resistance rejected, momentum fading, and one clear horizontal level standing between current price and a much deeper zone.
Critical Support: $4,381.57
This is the entire thesis. The horizontal line has acted as both floor and ceiling through the correction. A decisive close below it removes the last structural support before the base, and turns the current pullback into a confirmed downtrend continuation.
First Target Below: $4,000
The round-number zone where the ascending long-term channel support converges. This is the first area where buyers have historically stepped in during this cycle.
Second Target: $3,940.80
The 0% retracement level and the origin of the entire recovery attempt. A move here would mean a full round trip, wiping out the whole bounce off the lows.
Resistance Overhead: $4,570.30 → $4,696.95
The 38.2% fib and the recent rejection high. Price needs to reclaim both before any bullish case is credible again.
Why This Setup Reads Bearish
The Rally Failed Where It Had To Succeed
Recovery attempts inside a descending channel are common. What separates a genuine reversal from a bounce is whether price clears the channel and holds the 50% retracement. This one did neither — it tagged the boundary and reversed in a single bar.
Macro Context
Gold’s correction is unfolding alongside a rising yield environment that raises the opportunity cost of holding a non-yielding asset. Traders can follow live XAUUSD price action on Investing.com and cross-check the yield backdrop via the US 10-year Treasury yield on CNBC for real-time confirmation.
What to Watch This Week
The $4,381.57 Reaction
Everything hinges on this line. Price holding above it keeps the range intact and leaves room for another attempt at $4,570. A decisive close below opens the path toward $4,000 quickly.
Confirmation Requires Follow-Through
A single close below $4,381.57 is a signal; two consecutive closes below it with expanding range is confirmation. Until that happens, this remains a rejection inside a range rather than a completed breakdown.
XAUUSD Summary
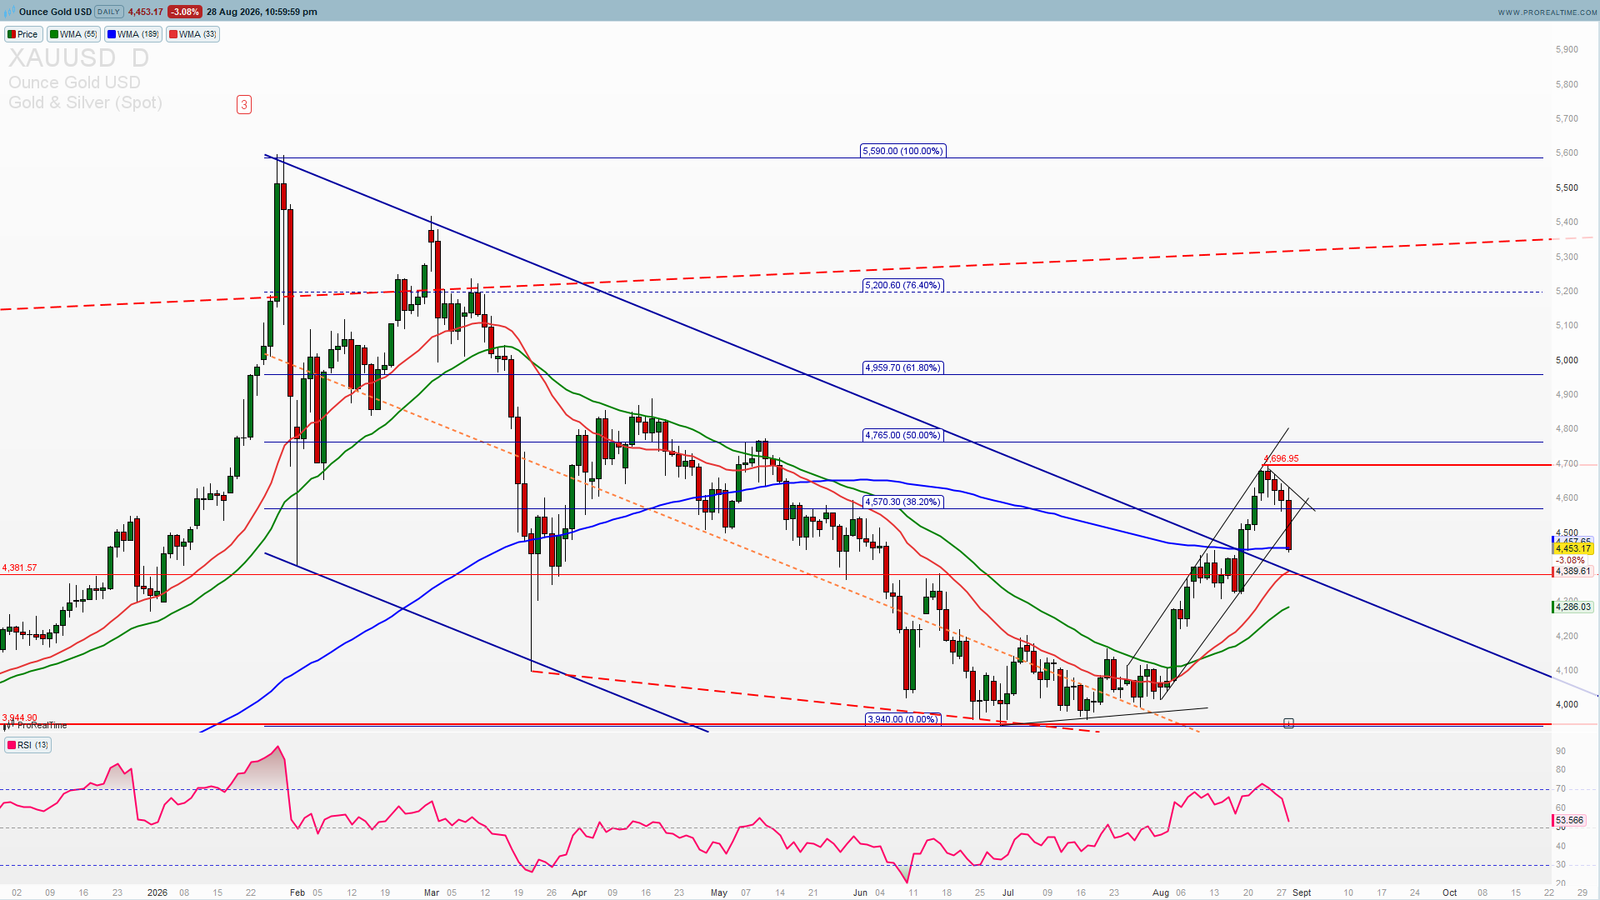
Gold at $4,453.17:
🔴 Bearish below $4,381.57 — targets $4,000, then $3,940.80
⚠️ Neutral between $4,381.57 and $4,570.30 — range-bound, no directional edge
🟢 Invalidated on a reclaim above $4,630 — that would break the descending trendline and reopen $4,765 and $4,959
Gold rejected exactly where the descending channel said it should, with RSI never reaching overbought during the entire recovery and moving averages still capping price from above. The structure now rests on a single level. Above $4,381.57 this is a range; below it, the path toward the $3,940 base opens with very little standing in the way.
Track XAUUSD and every major pair, index and metal in real time — live charts, moving average structure, and market bias on one screen with PST Terminal, included with the PST All-Access plan 7-days trial 8.99 EUR
Disclaimer: This analysis is for educational purposes only and does not constitute financial advice. Trading involves significant risk. Always conduct your own research before making any investment decisions.

1 comment