AAPL $300 target is not an illusion
Apple Inc. (AAPL) has quietly transformed from a hardware giant into one of the most financially pristine businesses in the world — and the numbers prove it.
Over the past decade, the company has steadily expanded its gross margins from 38% to nearly 47%, while simultaneously growing its return on equity to a staggering 171% in fiscal 2025. That’s not a typo. Apple generates extraordinary profits relative to the equity it retains — a hallmark of a true compounding machine.
What’s even more impressive is the consistency. Revenue has grown at a 5-year CAGR of ~8.7%, EBITDA margins have held firmly above 34%, and net income margins sit near 27% — levels most companies can only dream of. Meanwhile, Apple has been ruthlessly efficient with capital, driving asset turnover higher each year while keeping SG&A lean at just 6.6% of revenues.
The balance sheet tells a story of disciplined leverage too. Total Debt/EBITDA has compressed from 1.62x in 2017 down to just 0.69x in 2025, and net debt remains negative — meaning Apple holds more cash than debt. Free cash flow margins have averaged above 20% for years, funding one of the most aggressive buyback programs in corporate history — which explains why EPS has grown at a 5-year CAGR of nearly 18%, well outpacing revenue growth.
So the question isn’t whether Apple is a great business. It clearly is. The real question is: do these fundamentals justify a path to $300 — and what would need to go right to get there?
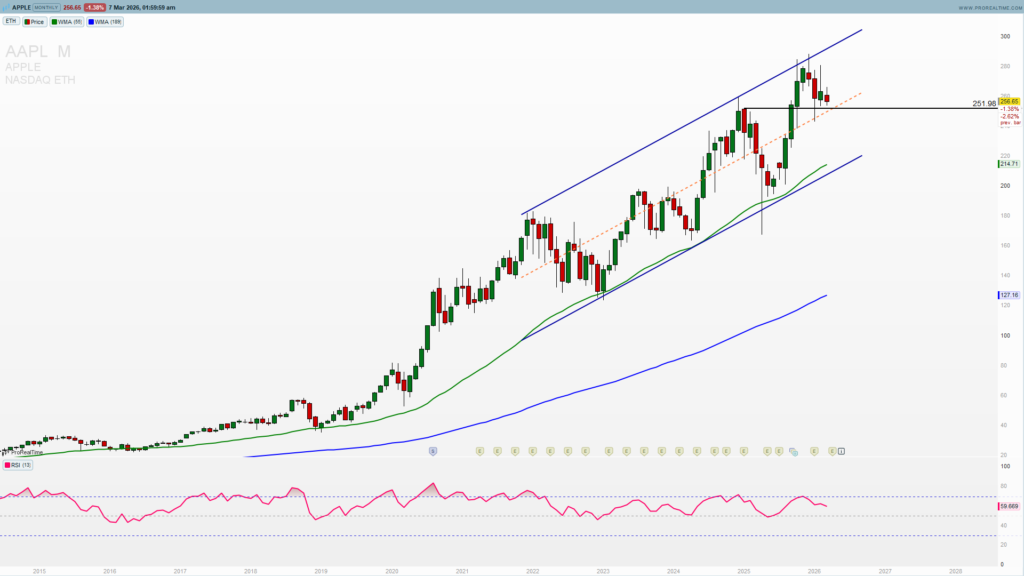
AAPL support is holding
AAPL is testing the 250 support. This is a key support for the upside continuation or a downside resistance. On the monthly chart we can see the ongoing bounce for two months after the January bigger drawdown and a rejection from 290-300 zone. This bounces and smaller range in February means that the selling momentum is losing steam.
Consolidation triangle for a new high?
We can see a strong triangle consolidation on the weekly chart that indicates price action more inclined to a continuation higher then a reversal lower. Taking a long-term uptrend in consideration this is a continuation triangle and not a rotation lower triangle. As we saw from the fundamental overview and AAPL valuation it is also supporting a technical picture.
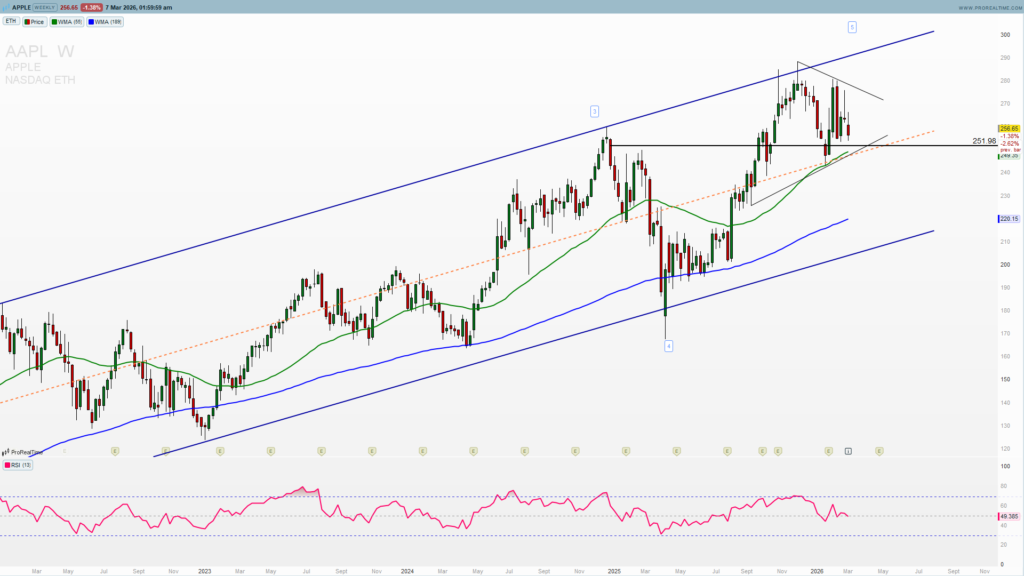
On this weekly chart you can see a strong support indicated earlier 250 (join to get premium analysis, weekly and mid-week newsletter and other tools for for your successful trading ). A significant bounce here and a breakout above 260 would lead to a 275 test. A strong close below 250 would mean that the valuation discount will be higher and the price action could test 220 in that case.
Trade this setup with my preferred broker 👇
This compression you can see on a daily chart below will lead soon to an explosive move. You should be prepared for this and use the chance this price action setup is offering you.
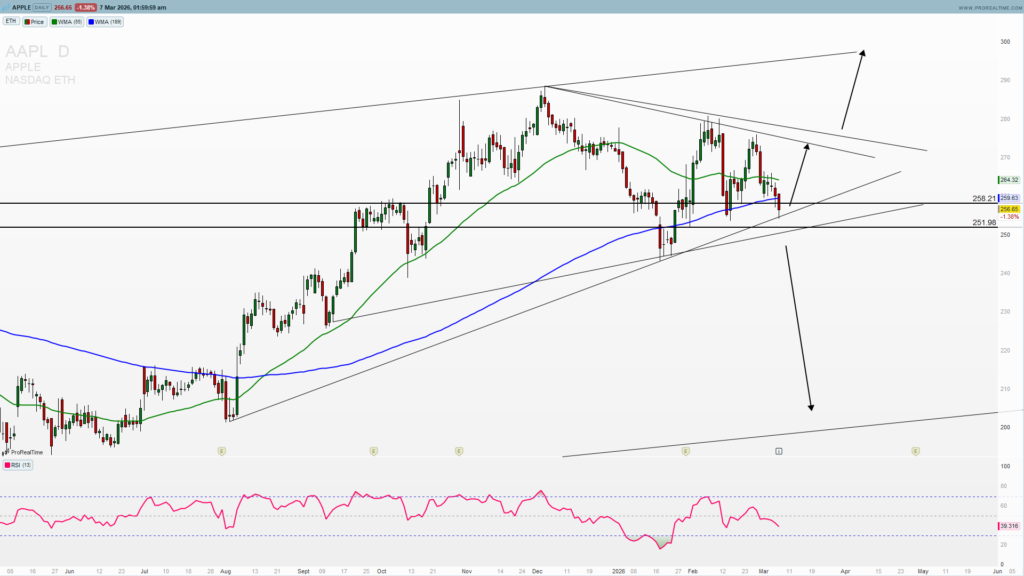
For me this trading setup is perfect and it gives such a good risk to reward that I will not miss and I also recommend this trade to my followers. You will find the trade in your trading dashboard.
Trade safe!