For related index setups, also read our SPX Rising Wedge Resistance and our XAGUSD Bullish Reversal.
The Nasdaq100 reversal setup is now the most important structural story on the index charts. Nasdaq100 futures (NQ) closed the week at 30,141.75, essentially flat at -0.15%, after touching a fresh year high of 31,097.25 just days earlier. That high landed almost exactly on the upper boundary of the rising channel that has contained this entire bull market since 2011.
This isn’t a breakdown yet. It is a rejection test at the top of a structure that has never been broken — and the speed of the move into it is itself a warning sign.
Nasdaq100 Reversal Setup — Extended Into 15-Year Channel Resistance
The chart tells a simple story. A multi-decade ascending channel has defined every major advance and correction since the post-2011 recovery. Price has touched the upper boundary only a handful of times in that span, and each prior touch was followed by a multi-month pullback toward the moving averages running through the middle of the channel.
The Rally Into Resistance Was Unusually Vertical
NQ ran from the year low of 23,251 to the year high of 31,097.25 — a 33.8% advance — without the orderly, stair-step structure that characterized earlier legs of this bull market. The move from roughly 24,000 to 31,000 happened in a compressed window, leaving price stretched well above both weekly moving averages, which still sit in the 24,000 to 25,500 area.
RSI at 60.85 Is Elevated, Not Exhausted
The weekly RSI sits at 60.85, below the classic 70 overbought line but well above neutral. Historically on this chart, RSI readings in this zone combined with a touch of the upper channel boundary have preceded pullbacks rather than continuations. The index does not need to hit textbook-overbought to mark a local top when it is this extended from its own trend.
The Channel Has Never Been Broken
Every prior test of the upper boundary across this 15-year chart resolved with a rejection back toward the channel midline or lower half. There is no precedent here for price closing above that line and continuing higher without a meaningful retracement first.
Nasdaq100 Key Levels — What a Rejection Opens
The confluence behind this Nasdaq100 reversal is straightforward: channel resistance, an unusually steep approach, and elevated RSI — all converging at the same price in the same week.
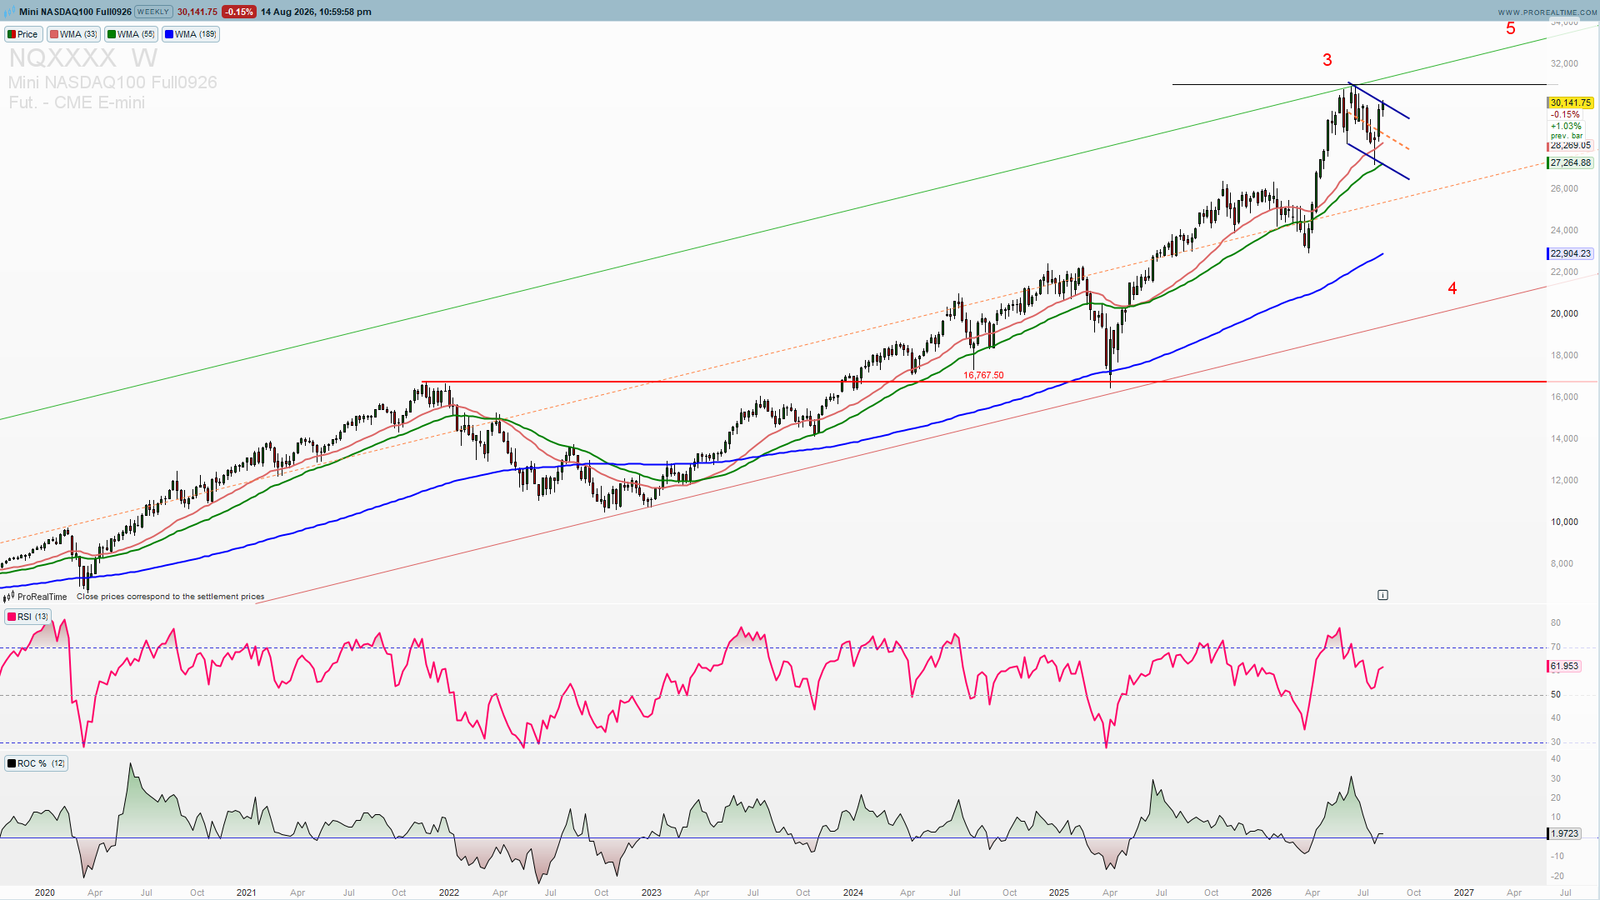
Resistance: 31,097.25 — Year High and Channel Ceiling
This is the line in the sand. Price already touched it and pulled back. A weekly close above this level would be the first break of this multi-year structure and would invalidate the bearish case entirely.
First Support: 27,828.52
The first meaningful pullback zone below current price, roughly 7.7% off the highs. A move here would leave the broader uptrend fully intact — a normal retracement inside the channel rather than a structural break.
Second Support: 25,528.78
This zone lines up closely with the moving averages running through the middle of the channel. A move to this level would represent a full mean reversion back to trend — deeper, but still constructive for the long-term structure.
Third Support: 23,722.88
Just above the year low of 23,251. A decline to this zone would test the lower half of the channel and mark a much more significant correction, though still within the bounds of the 15-year structure.
Founding Member Offer
Everything We Built. One Plan. Forever Price.
Terminal, Elliott Wave & ICT Scanners, full research library, and live signals — one login, no tiers.
Expiring today!
Why This Nasdaq100 Reversal Reads Bearish
Speed of the Approach Matters
The move into resistance was not a slow grind. It was a near-vertical run that left price stretched far above its own trend. Charts that approach major resistance this quickly tend to reject harder than ones that grind into a level gradually.
Sector Context
Nasdaq 100 has been the clear leadership index through 2026, anchored by AI and semiconductor names. A rejection here would likely reflect broad tech-sector cooling rather than a single-stock issue. Traders can follow live NQ price action on Investing.com for real-time confirmation.
What to Watch This Week
The 31,097.25 Reaction
This is the entire thesis. A weekly close above it breaks 15 years of channel structure and invalidates the reversal case. A rejection here, with price fading back below the recent high, keeps the bearish argument fully intact.
Confirmation Comes on a Break of 27,828.52
Until price closes a week below the first support zone, this remains a resistance test rather than a confirmed reversal. The move from touch to confirmed rejection still needs to play out.
Nasdaq 100 Summary
NQ at 30,141.75:
🔴 Bearish below 31,097.25 — targets 27,828.52, then 25,528.78
⚠️ Neutral between 27,828.52 and the year high — still inside the established channel
🟢 Invalidated on a weekly close above 31,097.25 — breaks 15 years of channel resistance
Nasdaq 100 just completed one of the steepest legs of its entire multi-year advance, running straight into resistance that has held for over a decade. RSI is elevated but not extreme, which historically on this chart has been enough to mark a local top. The confluence of channel resistance, the speed of the approach, and the RSI reading all point the same direction — lower, at least in the near term — unless price does something it has never done on this chart and closes decisively above the upper channel boundary.
Track NQ, the Nasdaq100, and every major index in real time — live charts, moving average structure, and Elliott Wave bias on one screen with the PST All-Access plan
—
Disclaimer: This analysis is for educational purposes only and does not constitute financial advice. Trading involves significant risk. Always conduct your own research before making any investment decisions.