• Home
  • Features
  • Live trading results
  • Blog
  • Dashboard
  • PST Terminal
  • Stocks Dashboard
  • Contact
January 13, 2026 by TraderNomad

Is Bitcoin Ready To Jump or Dive?

Is Bitcoin Ready To Jump or Dive?
January 13, 2026 by TraderNomad

For our current crypto setups, read the Bitcoin Bearish Setup and the Ethereum Bullish Setup.

Table of Contents

Toggle
  • Fundamental overview 
  • Bitcoin is consolidating above support 

Fundamental overview 

The market cap stands at approximately $1.84 trillion, with 24-hour trading volume exceeding $45 billion. On-chain metrics indicate low realized volatility at 23%, suggesting a potential breakout soon.
However, growing leverage in derivatives and fading spot demand pose risks for sharp moves.
 
On-Chain and Institutional Activity: BlackRock withdrew $50 million in BTC from Coinbase, signaling potential buybacks after days of selling.
 
Bitcoin open interest dropped to a four-year low of 316,000 BTC in options, which Fundstrat’s Tom Lee sees as a precursor to a rally.
ETF outflows continue, with $40 million from XRP ETFs contributing to price pressure.
 
Institutions are ramping up, with Coinbase noting they’re just starting to sell BTC to clients, amid expectations for the Clarity Act to pass soon.

Bitcoin is consolidating above support 

Bitcoin is holding above the 87000 support for now and is forming a consolidation wedge which could be broken in the near future.  The upside resistance level for the continuation higher into 108345 is 95000. A break below 87000 would turn a spotlight to 69000-73000 zone as it can be seen on the monthly chart.
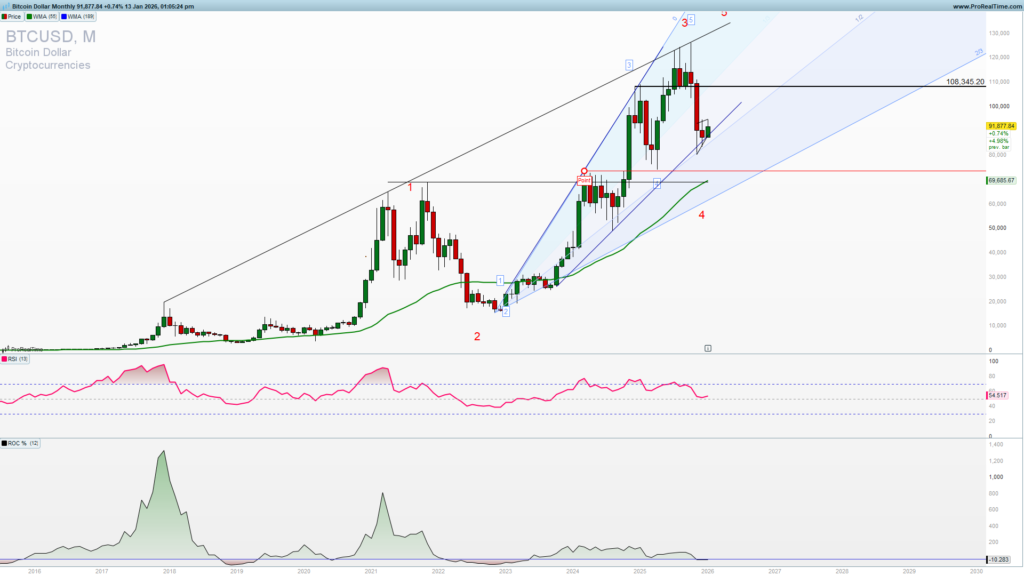
Bitcoin monthly chart

On the weekly chart we can see a clear upside five waves from the low and we will have fourth wave finished now with a run into a fifth wave to follow or we will see an extended correction into 70000 for a fourth wave finish. There is also a 73000-76000 support zone before 70000. Still long-term uptrend is not jeopardized and is still very valid and active.
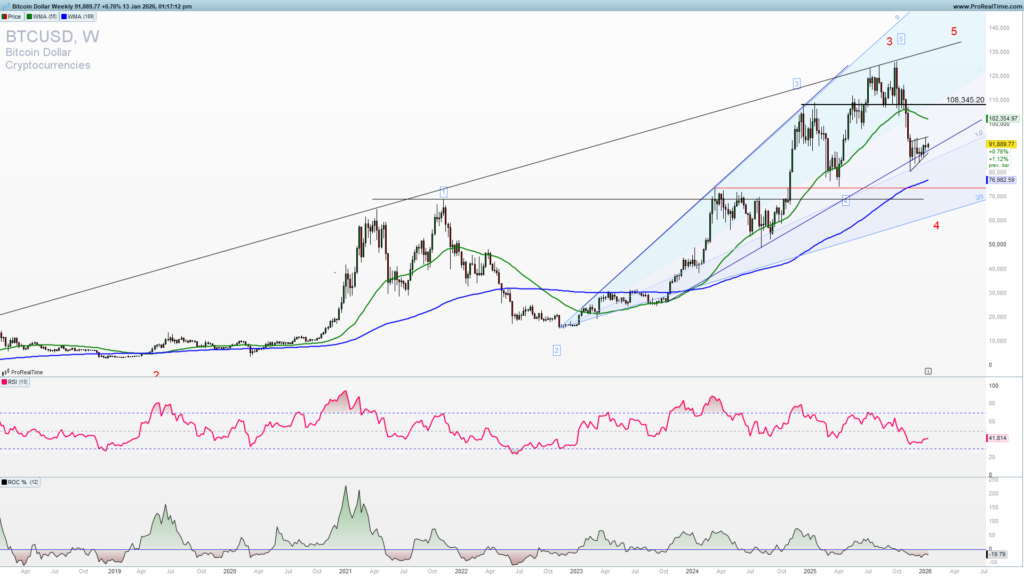
Bitcoin weekly chart

Dynamic of this price action suggest (join to get premium analysis and everyday updates with a free prop trading challenge account from partners) cautious approach. Long trade entry has a low risk and also good risk to reward if you place stops below 88000.

A push above 95000 would lead to a breakout higher and a clear ride to 108000 giving you a high reward for a low risk.
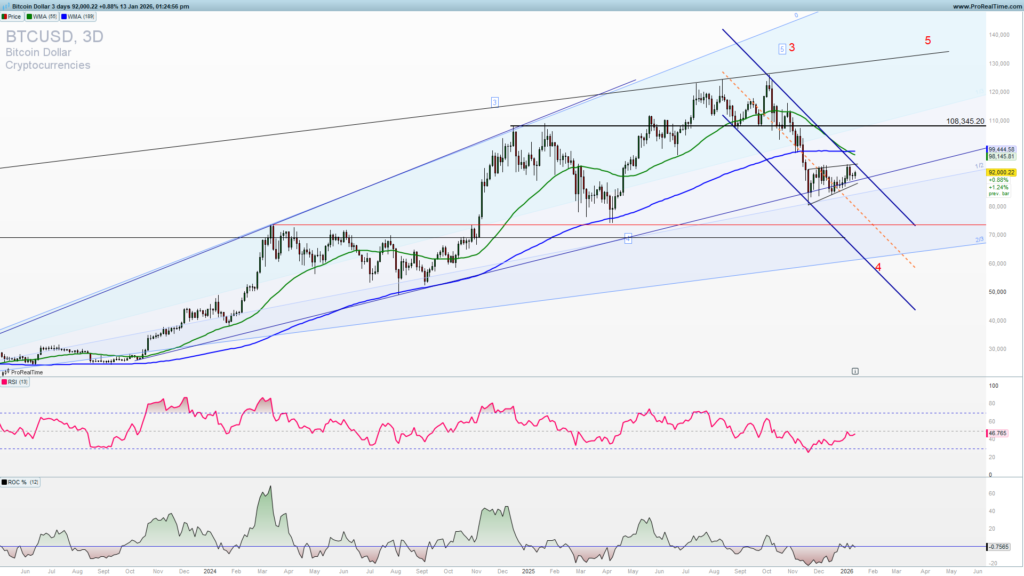
Bitcoin daily chart


On the other hand if we get a break below 88000 we could see an extension downside to 70000-73000 zone giving a short trade also a good risk to reward. Place short trade entries only in the case of a clear break below 88000.

Trade safe!


Previous articleWhere Will SLV Wild Ride End?Next article SPX - Will We See a first larger pullback in Q1?SPX weekly chart

Leave a Reply Cancel reply

Your email address will not be published. Required fields are marked *

Premium and free trade analysis articles

Recent Posts

Gold and Nasdaq Outlook: 3 Critical Levels in a Dangerous WeekOctober 22, 2026
Gold Support Holds: 3 Proven Signals for a Strong Rally to $4,400October 17, 2026
INTU Double Bottom: 3 Critical Levels After the Worst YearOctober 10, 2026

Categories

  • Trade analysis

Tags

August 2026 Bearish Setup Bitcoin Bitcoin Analysis 2026 Bitcoin Elliott Wave Bitcoin Price Prediction Bitcoin Sup BTC June 2026 BTC port Levels USD BTC Technical Analysis commodities Crude Oil Crude Oil June 2026 Elliott Wave Elliott Wave Oil Elliott Wave Signals equities GLD Analysis GLD ETF GLD Price Target GLD Technical Analysis gold Gold Buy the Dip Gold ETF 2026 INTU Intuit July 2026 Nasdaq-100 NVDA NVIDIA Oil Price Forecast ProSignalTrades 2026 QQQ Rising Channel SPDR Gold Shares SPDR Gold Trust Stock Analysis Technical Analysis Trading Research Platform Trading Signals Review Weekly Chart WTI WTI Analysis WTI Technical Analysis XAUUSD

Why PST

15+ years of trading experience — analysis built on real market knowledge, not theory.

Get Started Now!

Contact

info@prosignaltrades.com

Recent Posts

Gold and Nasdaq Outlook: 3 Critical Levels in a Dangerous WeekOctober 22, 2026
Gold Support Holds: 3 Proven Signals for a Strong Rally to $4,400October 17, 2026
INTU Double Bottom: 3 Critical Levels After the Worst YearOctober 10, 2026
ProSignalTrades Wordpress Theme. Proudly Built By PST
TOS and Privacy Policy
Disclaimer: ProSignal Trades (prosignaltrades.com) is an educational and analytical platform providing market software, scanners, and research tools. We are not a broker, do not handle client funds, and do not provide financial advice. ProSignal Trades is completely independent and has no legal connections with any regulated or unregulated brokerage entities worldwide. Trading involves significant risk. Full Disclaimer available Risk Disclaimer

Recent Posts

Gold and Nasdaq Outlook: 3 Critical Levels in a Dangerous WeekOctober 22, 2026
Gold Support Holds: 3 Proven Signals for a Strong Rally to $4,400October 17, 2026
INTU Double Bottom: 3 Critical Levels After the Worst YearOctober 10, 2026